


Don’t Do This When Teaching Graphs
To enjoy the week before Christmas break, I decided to try out a lesson idea I had about pictographs. I built this lesson around misconceptions that students always have about keys with numbers larger than one. The day before I taught this lesson, I was asked to teach math at a moment’s notice in another third grade class. When this third grade class interpreted a pictograph with a key of four, I noticed that this was really way too easy for these smart students. I decided to change my planned lesson idea into something more challenging. This is how the lesson went…
First, I did a quick lesson for understanding. I surveyed the class about their favorite ice cream: vanilla, chocolate, or strawberry. I then made a frequency table with this information on the board. With some yellow circle die-cuts with one circle to represent two children’s votes, I asked the class how many votes needed to stand for each flavor. Students did this very well even if this required half of a circle for one person. Then I had each flavor group stand in a different area of the room and I passed out the number of circles the children told me to each group. When I passed out the circles to each group and instructed the students to write their name on a circle, some disequilibrium arose. Students said they didn’t get a circle. I told them to talk to their group and they finally understood that they would need two names on each circle. I couldn’t have been more proud of this part of the lesson and the mathematical practices that arose from their discussion. Then came the next part of the lesson…

I previously gathered real life data about students’ favorite Christmas candy.
- I chose four types of candy: fudge, candy canes, M&M’s, and chocolate Santa’s. I gave three third grade classes each a roll list with a blank beside it for the students to write their favorite candy on. I collected these vote (data) sheets right before the lesson (mistake #1 don’t do this). I made six copies of the data sheets for each of the groups.
- In the lesson I presented the children with the data and told them to create a tally chart/frequency table with the data. Students waded through this for a long time without consistent results. I should have counted the data before I passed it out even though I had estimated the results to around a total of 66 students. I ended up having to total it up while the students were counting (mistake #2 don’t do this). Have your data counted before you pass it out, so you know when your students are way off. (But, hey, in my defense, I have been pulled in all directions lately, substitute, fill in secretary, test coordinator, you name it.)
- I made one student in each group of four responsible to count each class’s data since there were three classes and one student to record the data on a table. This worked very well to keep every child involved in the group.
- We stopped the lesson to ensure the children had the correct data before we proceeded with graphing. I wanted to be respectful of the teacher’s time while I was in her room, but I may have had them check to see if their data was correct in a different way, such as, compare your data with a different group and see if you agree before I just revealed the correct answers.

Next, I told students their key had to be 5 or more (I really had 6 in mind), but the teacher was concerned that it wouldn’t come out evenly for the students. The data had to be slightly altered for the die-cut circles to come out with wholes and halves. She didn’t want the students to have to deal with smaller fractional parts. I was actually okay with the students having the data not come out evenly because I wanted this to be a challenge for them to grapple with. In the real world, data doesn’t come out all nice and clean. Third graders had already proven themselves with a key of four, and I felt like they needed a challenge. I wanted them to discuss how much of a circle to cut apart. Again, I wanted to be respectful of this teacher’s time, so I allowed this and the students’ graphs all turned out pretty much perfectly. No fun :/ There was no argument over how much of a circle to cut apart. (mistake #3, don’t make your data work out perfectly). Needless to say here, I had many reflections after this lesson. This was definitely not my best moment as a math coach (I am at a new school this year). BUUUUUT!!! I loved this lesson, it was so great, even though it wasn’t! I know exactly what to do next time to make it better, and it would be an exceptional lesson with lots of mathematical practices involved! Next steps for students after this lesson–ask students what would have happened if the key was 5 or 6 to at least get them to think about this.

Cyber Smile Monday and Tuesday Sale November 30-December 1!
Don’t miss out on this Cyber Monday and bonus Tuesday Sale!!! All items in my store will be 28% off!
Happy Thanksgiving to You and Yours!
I wish you a very Happy Thanksgiving with your loved ones! I want you all to know, followers, that I am thankful for you!
A New Bulletin Board Idea
Are you in need of a fall bulletin board idea? Look no further! Have your students help you create an advent calendar of sorts. With this bulletin board, I had 30 children write something they were thankful for and tell why they were thankful for it. Each day I flip over another square so that we can see another day of thankfulness. I bought 6 inch square card stock from the scrap book section and the little clothes pins at Hobby Lobby. I already had some twine and the fake fall leaves to embellish the board. You could repeat this idea with Christmas or any month really. The items that are displayed may be different but the same concept could be applied.

Don’t Take This for Granted When Teaching 5’s Facts Multiplication
Most people assume the 5’s are easy for students to learn because they can count easily by 5’s. That may be true, but that still requires counting to occur. That is still not the best method for them to become fluent because the method isn’t efficient. Now, if your students can tell time, then they can easily become fluent with their facts by looking at the clock and thinking of the middle of the clock as having a “x5” literally taped in the middle. Then they can visualize the numbers around the edges as the other factor. The product or answer will be the number of minutes that each number on the clock represents. Look at the picture for further clarification. I must say that you may think that students will naturally draw the correlation between the clock and their 5 multiplication facts. However, this is not always the case and may need to be pointed out especially to your lower performing students.
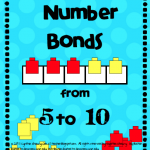
What do you see? A Freebie?
I have been missing in action from my blog lately. Hopefully this will make it up to all of you faithful followers 🙂 ! I have been working on this packet of addition fact lessons that I used with intervention groups all last year with much success. The lower students really seemed to enjoy the thinking aspect of these lessons. I have been working on putting this into a format that is cute enough to post. Because I have been working on the whole packet for months, I thought I would give you a free preview sample in the meantime. I will be posting the whole packet soon for sale. Without further adieu, here is the Freebie! I hope you enjoy using it!

Thanks to Winchester Lambourne for the spooky eyes clip art!
Nifty Tricks for the Number 6!
The other day I came across this and never realized that 6 multiplication facts repeated in this way or had this pattern! Imagine, I have been looking for patterns in the 6’s for years and never realized this. Did you?!

I mean I knew you could double your 3’s facts to find your 6 facts, but I never realized this happened with the even numbers. I am sure you can tell by the image above that the factor multiplied by 6 repeats in the ones place of the product! Hmmm, I wonder if this happens with more digits? Well, does it? 🙂 What a great problem to pose to your students. Then ask them to show other examples of this working or not working with larger numbers. I wonder about odd numbers….does this idea work with odd numbers? Hmmmm? What fun!!! Do you know any more tricks that work with 6?
A Giveaway!
I’m so excited to be teaming up with Winchester Lambourne who is a very talented clip artist! Checkout her adorable Halloween, Thanksgiving, and Christmas sets for your upcoming projects! She is offering a giveaway for 10 packs of clip art. This will be going on from today until midnight Thursday. The winner will be announced Friday!

Also, that’s not all folks! I will be giving away 2 items of your choice from my TPT store!

All you have to do is register to win here on Rafflecopter! Easy peezy, lemon squeezy!
Congratulations Elaine who is the winner of the giveaway!!!
(so sorry, but I forgot to announce this here Friday!) I announced it everywhere except my blog :/.
How Do You Teach Rounding?
To teach rounding I take several approaches.
The first method I use is to teach rounding with a sentence strip number line. I have students build a number line on sentence strips with whatever numbers we are working on. If they are working on the nearest 1,000 and nearest 10,000 for example, I may double side the number line sentence strip. If we are working on nearest 10 and 100 then I would double side the sentence strip counting by those two numbers. Here is how I have students build their sentence strip without much fuss.
First, I have them put a finger space down with one finger and make a mark. We put a zero here. I also have them leave a finger space before the end. They put the last number here such as 10,000 in this case since we were rounding to the nearest thousand.


Then, I have them fold the strip in half so that students can at least find a mid point. They put a mark at the mid point.
I have them put four fingers down to hold the space to make the next mark. Students repeat this four finger spacing until they get to the midpoint and then repeat the four finger spacing after the midpoint. This gets a fairly even number line if students do this. IT ISN’T Perfect, but it’s close enough to reasonable spaces give or take the size of the students hands.

Next, students label the numbers underneath the marks.


This will give students the numbers they need to use when making a number line sketch such as in the rounding roller coaster model I like to use. Before actually talking about rounding. I like to pose a number such as 8,456 and ask students where this number would fall on the number line. I have them place their finger where they think the number would go and I do a quick sweep around the room to look for understanding.
Here is how you can progress to the rounding roller coaster. Whichever numbers the students’ fingers are pointing between on the number strip go on the end of their roller coaster. For example with 8,456. The numbers would be 8,000 and 9,000.
Next, have students put the midpoint number in between the numbers on the two ends of the roller coaster. Then have them put a dot where the number they are rounding actually is. Explain that when a roller coaster is on top of the hill at the midpoint it will coast all the way to the end. If the roller coaster isn’t all the way at the midpoint then it will coast back down to the beginning. Whichever side it coasts to is the answer.

Now of course in the midst of all this, I have students learn the rhyme “4 or less let it rest, 5 or more raise the score” so that students have another rounding strategy to fall back on.
Now the rhyme and the roller coaster I cannot take credit for. I either learned it on the internet somewhere or from another teacher. I can’t remember, but both of these strategies support students’ understanding. These are my preferred ways of teaching rounding. Now, of course you will have students who don’t understand the above because they cannot count that high or have understanding of numbers that high. That is when I give them some counting practice using these number charts:
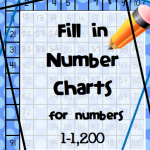
This is free in my TPT store:

And you can get these which count to larger numbers and they cost $4:

Or these count by smaller numbers up to 1,200 and are $7. I use these a lot with kids at school. They are great for up to grade 3 or as an intervention for older kids.

Now here is what I do with students who are seriously struggling. I don’t like teaching rounding this way because it really takes the number sense out of what they are doing, but some students just need to know how to get the right answer and do not have the number sense to build on to be able to round with understanding.

I showed the method above to a group of 5 struggling learners and all were really getting correct answers by the end except a resource student. Being able to write something down on their paper before they did much thinking really helped the students. To know that they could go ahead and fill in the zeros and fill in the beginning really helped them. However, like I said this isn’t the best way to teach for understanding.